
FieldOps · fibre and utility works
From digging to handover, every phase on the map.
FieldOps is the platform I built for an MRO partner and its subcontractors rolling out fibre. Digging, cable blowing, splicing and inspection run in one system, with the GIS map as the starting point. It is in use today on sites in Flanders, Belgium.
- In use on sites in Flanders
- Import Comsof designs directly
- Main contractor and subcontractors in one system
- Adaptable to any client
- Built on more than eight years of hands-on fibre site experience
Where things often go wrong on a fibre site
Digging reports, blowing progress and splice photos come in through WhatsApp, email and Excel, and nobody has the full picture.
The site manager phones around to find out which phase is done, which crew is where and what is still waiting for inspection.
Metres, manholes and photos have to be pieced together afterwards for the bill of quantities and the handover.
Structure
How a site is organised in FieldOps
Everything is connected, from the project down to the last splice. Whatever you look for is where it belongs.
- 1
Project
A contract, for example the roll-out in a municipality.
- 2
Zone or POP
The area around one POP, with its connections.
- 3
Excavation phases
The civil works, split into phases of about one working day.
- 4
Cable blowing
Per route, as soon as the excavation phases underneath are complete.
- 5
Splicing
Per chamber: closures, POCs and DPs.
- 6
Inspection and handover
Approval, measurement statement and as-built.
One file per route
Each route has everything in one file: lengths, chambers, reel or drum, every blowing step, the photos and the inspection. When a question or complaint comes in, one screen tells the whole story. Besides the route, every point in the network has its own file too: POP, PDP, DP and POC, with per cable how many splices are done.
Work moves on by itself
As soon as all excavation phases under a cable are complete, that cable is automatically ready to blow. Nobody has to phone it through or update a list.
How it works
One site, from the first dig to inspection
Real screens from FieldOps. Names of people and subcontractors, streets and addresses have been made unreadable.
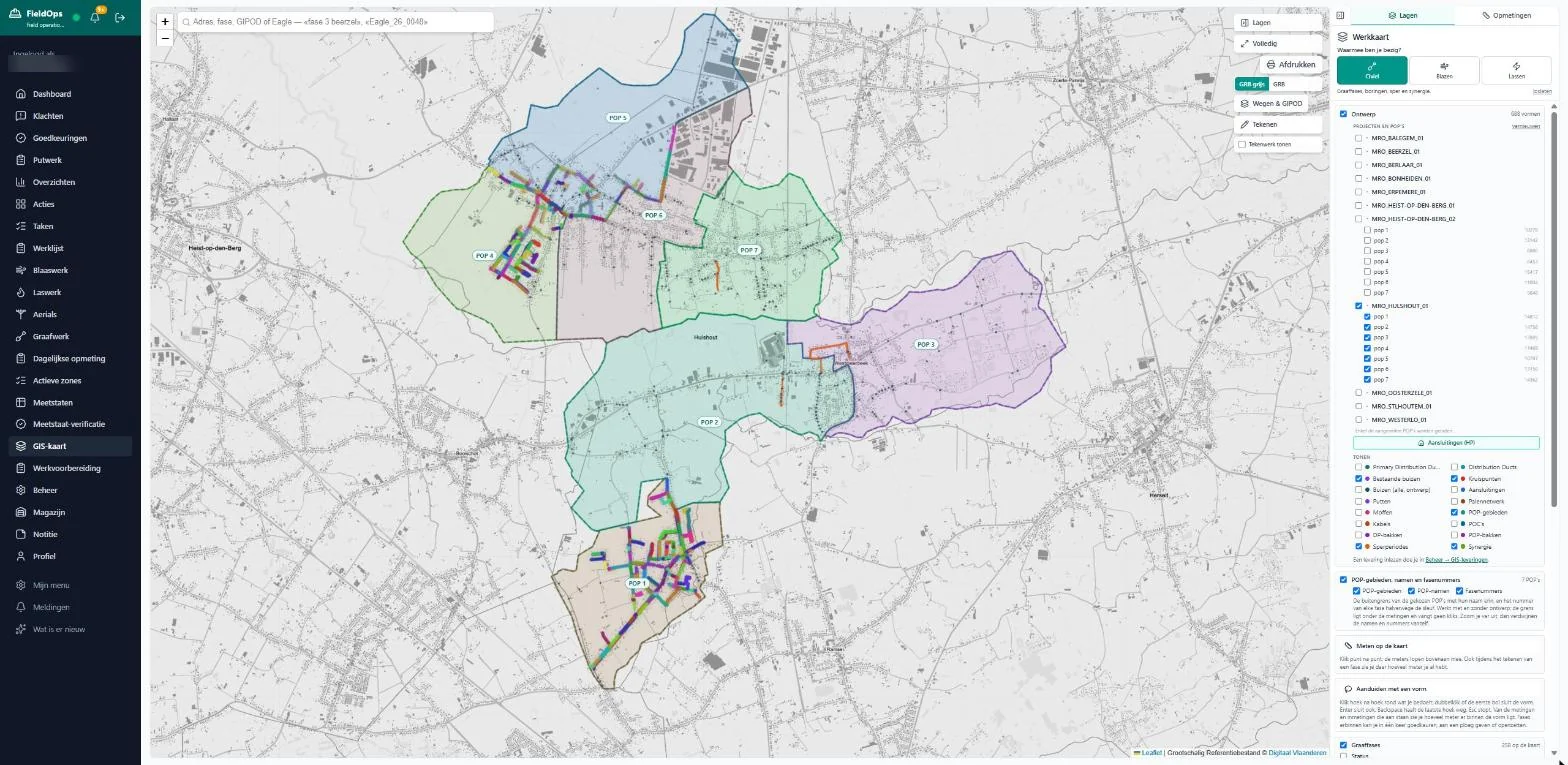
The map as the starting point
Design, POP areas and phase numbers sit on top of the official Flemish base map (GRB). You search by address, phase or GIPOD number, measure distances on the map and see the status of every phase. As-built measurements are laid next to the design, so deviations stand out.
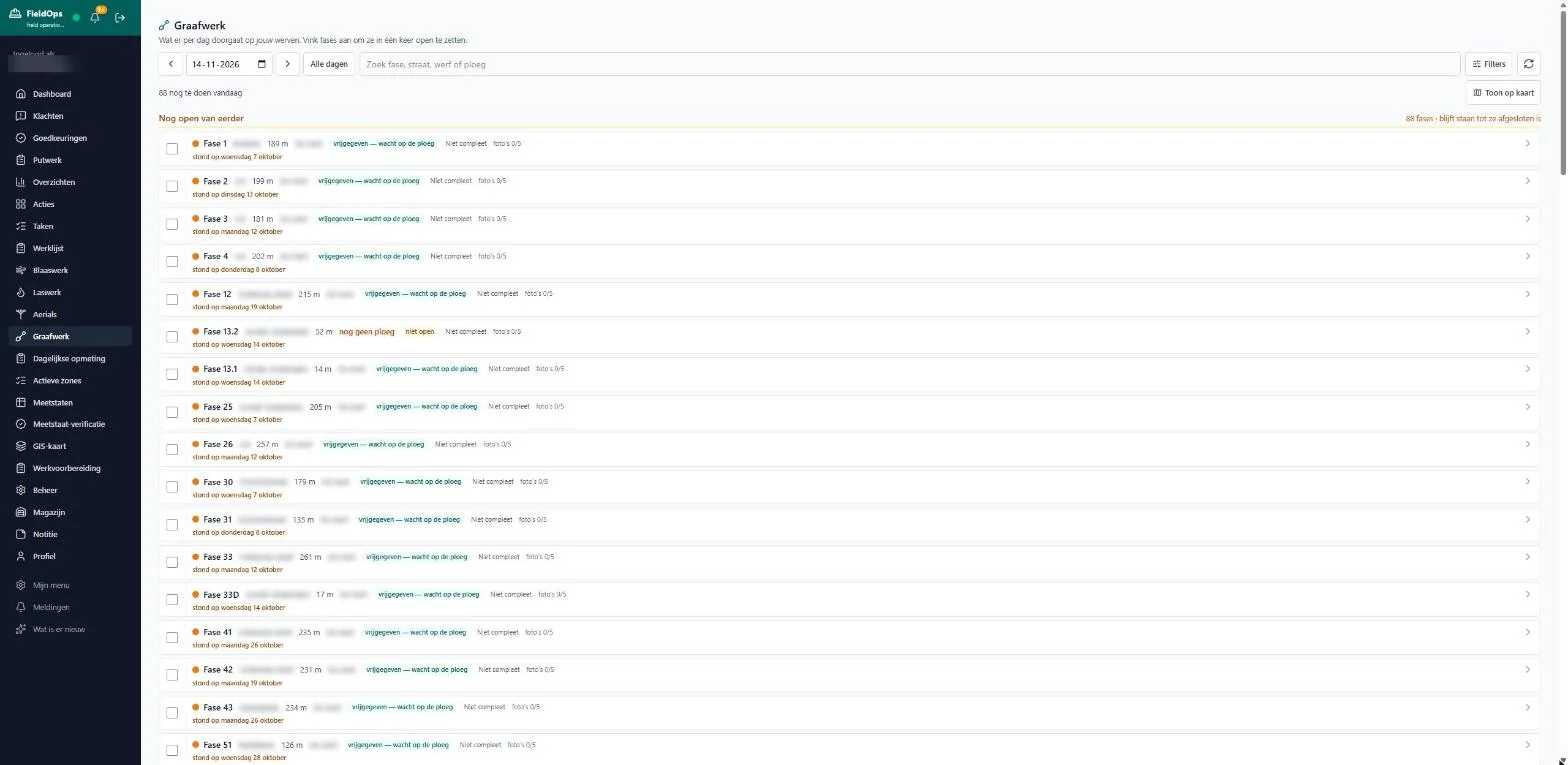
Digging, day by day
Every digging phase with its length, crew and status. The site manager releases several phases to a crew at once, sees what is still open from earlier days and which photos are missing before a phase is complete.
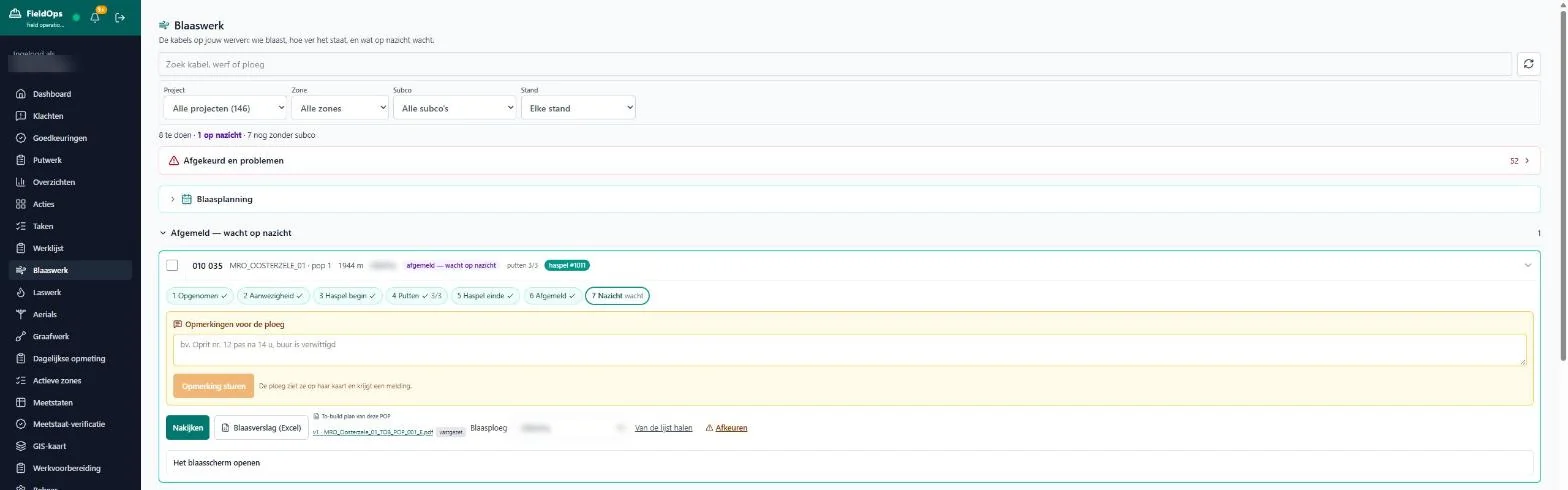
Cable blowing in seven steps
Per cable you see the area, length, crew, drum or reel and how many manholes are done. The blower goes through seven steps: accepted, on site, drum start, manholes, drum end, signed off and inspection. Notes for the crew appear on their map, with a notification.
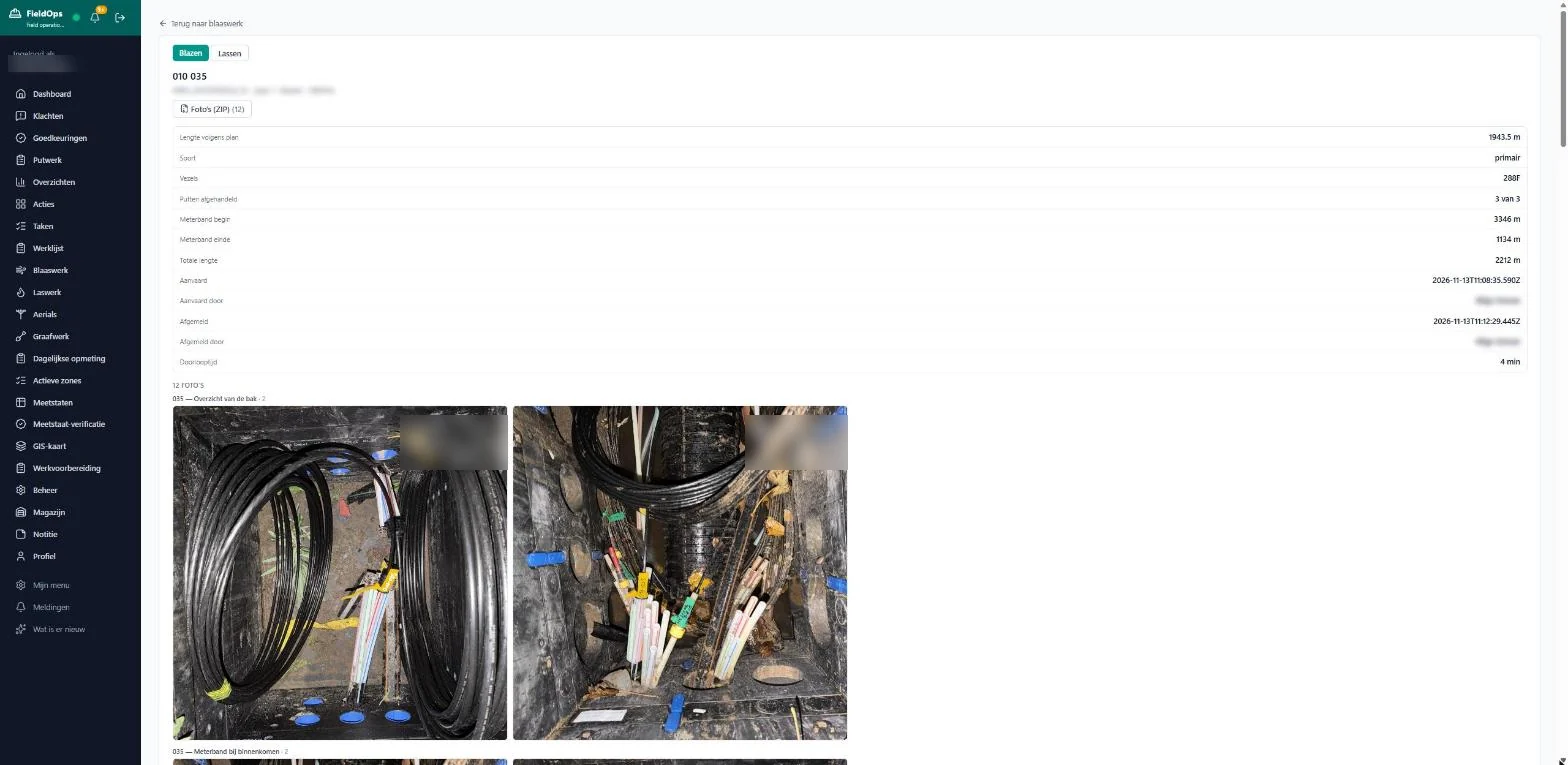
One file per cable
Planned length, fibre count, meter reading at start and end, total length, when the work was accepted and signed off, the lead time and every photo of the chambers. Earlier blowing attempts are kept. Photos download as one zip, the blowing report as Excel.
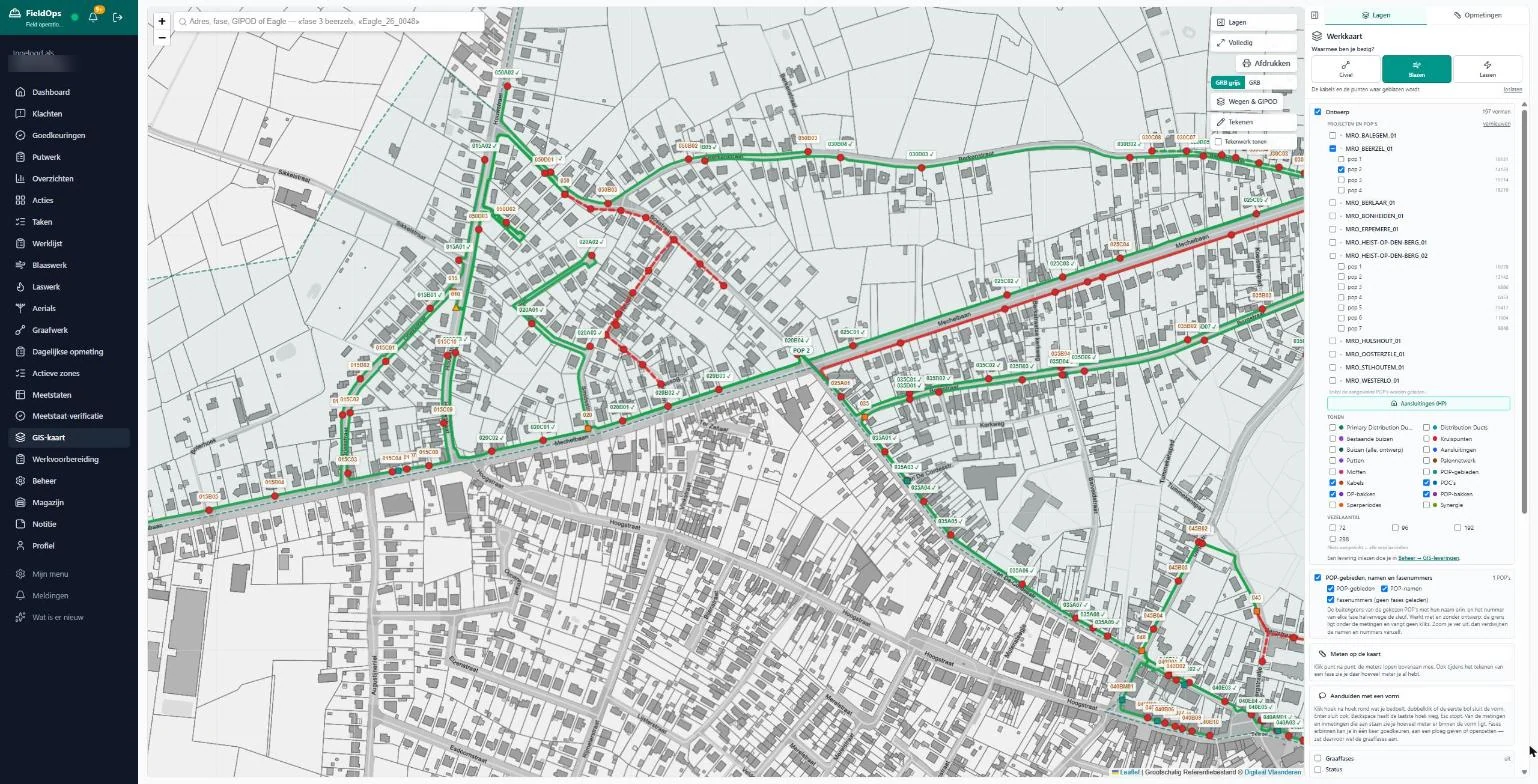
The map as the blower sees it
The blowing view shows the cables and the points where blowing happens, with the status of every cable. Green is done, red is still to do.
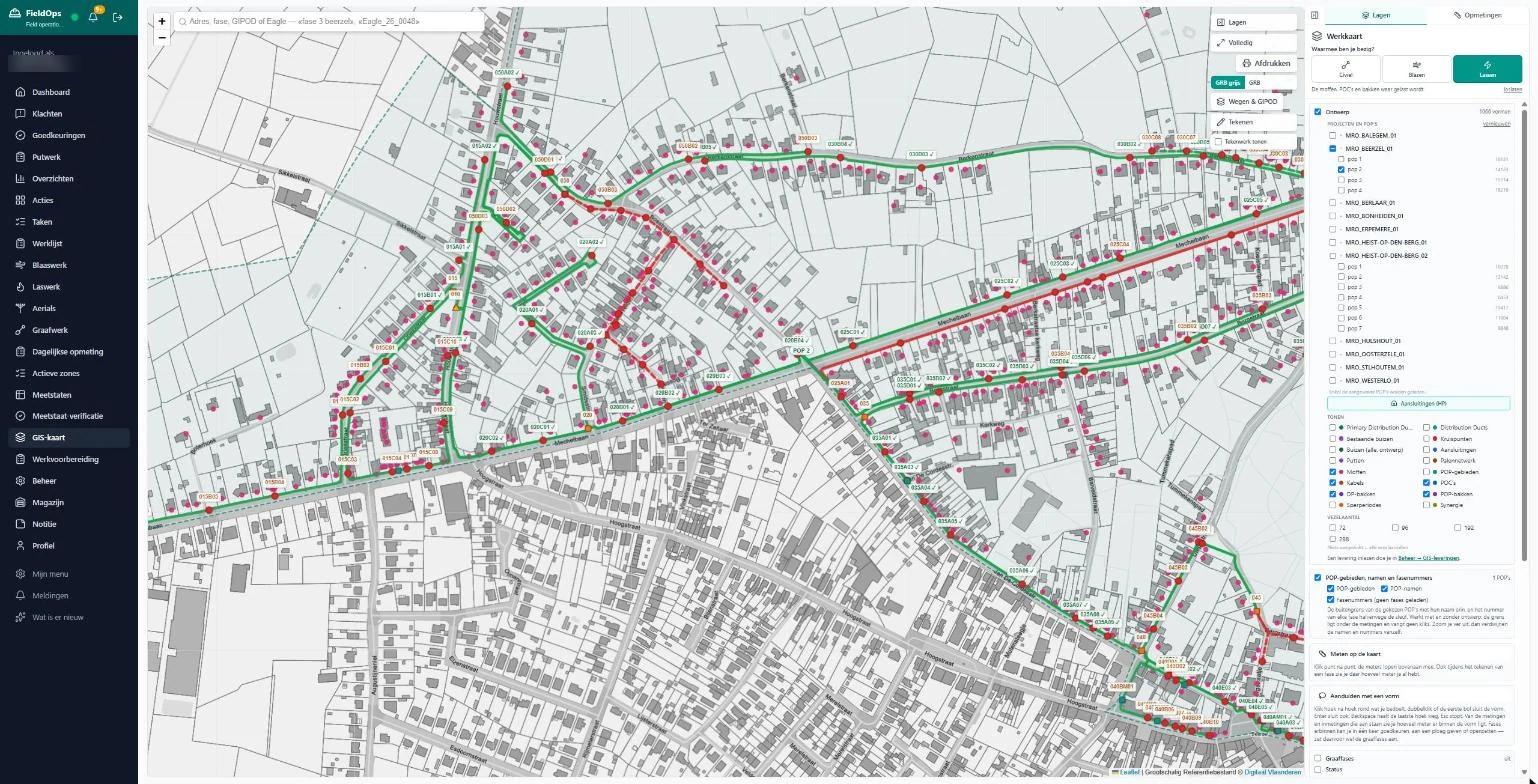
Splicing per manhole
The splicing view shows joints, POCs and DP boxes. You choose the crew per manhole, and work that someone else has to do is passed on to another crew or the manhole crew.
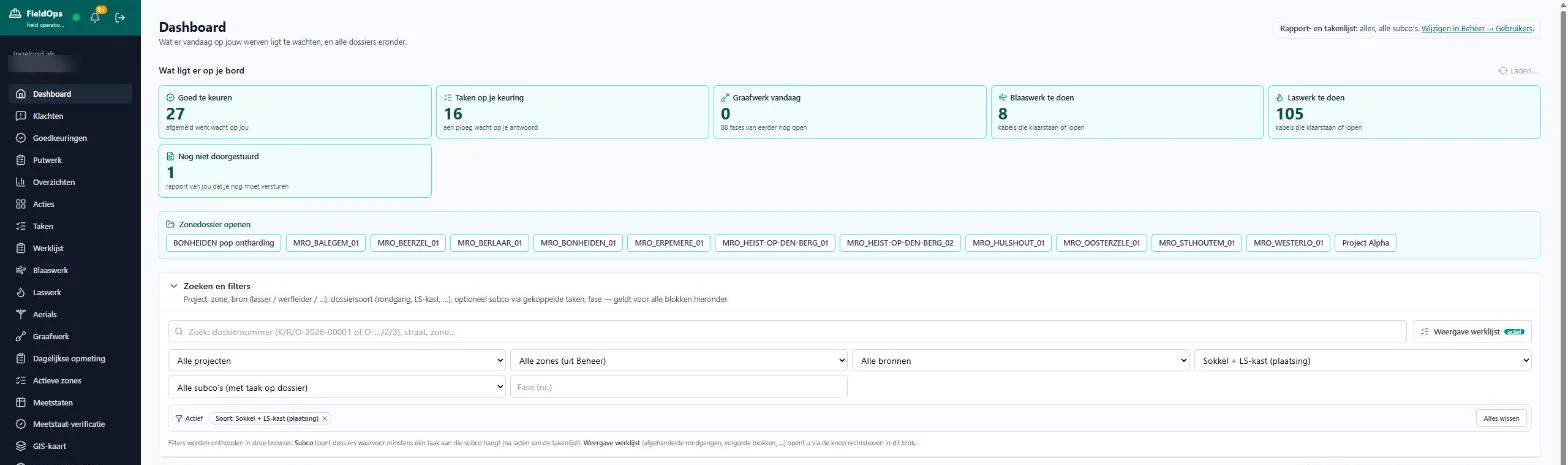
What is waiting for you today
The dashboard shows work waiting for approval, tasks where a crew is waiting for your answer, today's digging, cables ready for blowing or splicing, and reports that still need to be sent on. Rejected work and problems on a cable are listed separately at the top.
Minimal effort, maximum result
From design to as-built, with as little manual work as possible
Import the design from Comsof
Upload the Comsof export as a ZIP. Cables, POCs, DPs, connections and the design warnings appear on the map straight away. Nothing to retype.
Excavation phases cut automatically
The trenches from the design are split into phases of about one working day. You review them, split or move them and assign them to an excavation crew.
GPS surveying
The installation is surveyed with GPS, including with a Leica Zeno. What was measured on site stays untouched: no import or comparison changes a measurement afterwards.
Import the as-built
Load the as-built DXF or DWG files. Each bore becomes a separate layer next to the design, so deviations are visible at once.
Measurement statements and progress
Approved work is bundled per subcontractor into an Excel measurement statement, with one sheet per POP. Each item appears only once.
OTDR measurements checked automatically
Upload a POP's OTDR measurements in one zip, even thousands at once. FieldOps checks them against the standards and shows what failed and why, with the trace alongside.
Material statement: design versus execution
What the design plans for trenches, ducts, cable, chambers and closures sits next to what was measured. A deviation stands out during the work, not only at invoicing.
What you gain
Fewer phone calls, faster invoicing, everything on record
One status for everyone
Main contractor, site manager and every subcontractor look at the same map and the same numbers. No more conflicting Excel versions or WhatsApp groups to dig through.
Measurement statement in a few clicks
Approved phases and surveyed metres are ready per subcontractor for the measurement statement, with export to Excel. No more evenings of adding up, and every item appears only once.
Proof for every piece of work
Photos, meter readings and timestamps are attached to the phase or the cable. When a question or complaint comes in, the proof is right there.
Nothing gets stuck
Work awaiting approval is listed at the top, with how many days it has been waiting. Rejecting it sends it back to the same crew with a reason.
Materials under control
Book stock in and out and move it between warehouses. Items below minimum stock stand out, so you order in time.
In the office and on site
Runs in the browser, on the site manager's laptop and on the crew's phone. Nothing to install in the office.
More screens
Take a look around FieldOps
Browse through real screens. Names of people and subcontractors, addresses and prices have been made unreadable.
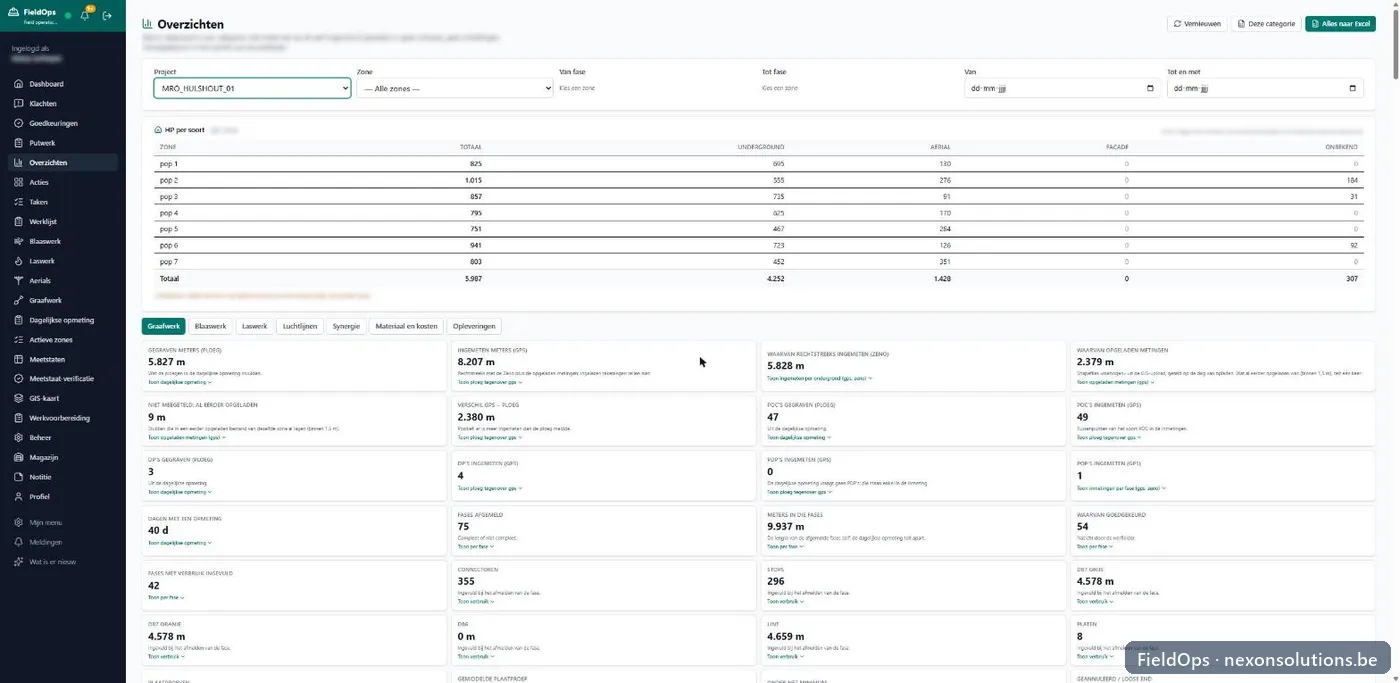
1 of 6
Overview per project
Connections per POP zone, and per phase the metres dug, surveyed and approved. You see at once how far a site has progressed and where crew and GPS figures differ. Everything exports to Excel.
Tailored to your client
The screens on this page come from a project for a Belgian network operator, set up according to its way of working and handover requirements. If you work for Fiberklaar, Proximus or another client, I adapt FieldOps to that: other phases, other checks, a different measurement statement. That tuning is part of starting your project, and what we build together can then serve other sites too.
- Import Comsof designs directly
- Phases, checks and measurement statement to your client's rules
- Also usable for water, gas or electricity works
Everything else in FieldOps
Site walks and tasks
The site manager walks the site and records points with photos. Each point becomes a task for the right crew or subcontractor, with a conversation attached.
Complaint files
From report to resolution in one file: emails, photos, follow-up appointment, forwarding to the subcontractor and a log of every step.
Site info for residents
Residents see the planned works in their street on a public page, without logging in. That saves phone calls.
Plate load tests
All plate load tests per project, zone and subcontractor, with approval and export to Excel.
Plinth and LV cabinet
A checklist with photos for the installation, from draft to final report.
Extra work
Extra work recorded separately with dimensions and photos, ready for the measurement statement.
Trench survey and soil types
Surveys per soil type with a measuring wheel or GPS, with reference prices in the admin.
Warehouse with web shop
Subcontractors order their materials online, the warehouse books stock out with QR codes, counts and transfers between warehouses.
Notifications and reminders
Per topic you choose who gets what, in the app or by email. Work that stalls gets a reminder automatically.
Microsoft 365 and SharePoint
Sign in with your Microsoft account and documents synchronised with SharePoint.
App for the site
An Android app for tablets and phones on site, alongside the web version in the office.
Roles and rights
Site manager, crew, subcontractor, coordinator or city manager: everyone only sees what is meant for them, and every change is logged.
Where it stands today
The core runs and is used on site every day. What comes next is fine-tuning: looking at what each party really needs on site and adapting to that. For a new partner that means we first look together at how you work today, and then set FieldOps up for it. I spent more than eight years in the field myself, working on fibre networks (GPON, FTTH and greenfield projects), including splicing and troubleshooting.
Who it is for
- MRO partners and main contractors managing several subcontractors
- Subcontractors for digging, cable blowing, splicing and manhole work
- Site managers and planners who want the overview without phoning around
Other utility works?
The structure of phases, crews, inspection and a map is not limited to fibre. If you work on water, gas or power lines, I am happy to look at what fits.
Want to see FieldOps for your sites?
I am happy to show the platform in a demo, and to come and see how you work today. The first conversation is free.