
Factory automation · production monitoring
Every factory live in view, from production to power and doors.
For a government-owned company outside Europe I built a platform that automatically follows the production, the power supply and the doors at more than 340 factories. IoT controllers in the factory send their readings, and the platform turns them into daily totals, charts and alerts.
- More than 340 factories on one map
- Production per device, from every 5 minutes to per year
- Power outages and suspicious production flagged automatically
- Government, private and commercial sectors viewed separately
Where things go wrong without monitoring
Production figures arrive days later, on paper or by phone, and nobody can check them.
You only notice a power outage or a stopped machine when the daily output disappoints.
When a door was opened or a counter changed can no longer be traced afterwards.
How it works
From the meter in the factory to the overview in the office
Real screens from the platform, in its English version. The client's name, the logo and the names of factories and devices have been removed or made unreadable.
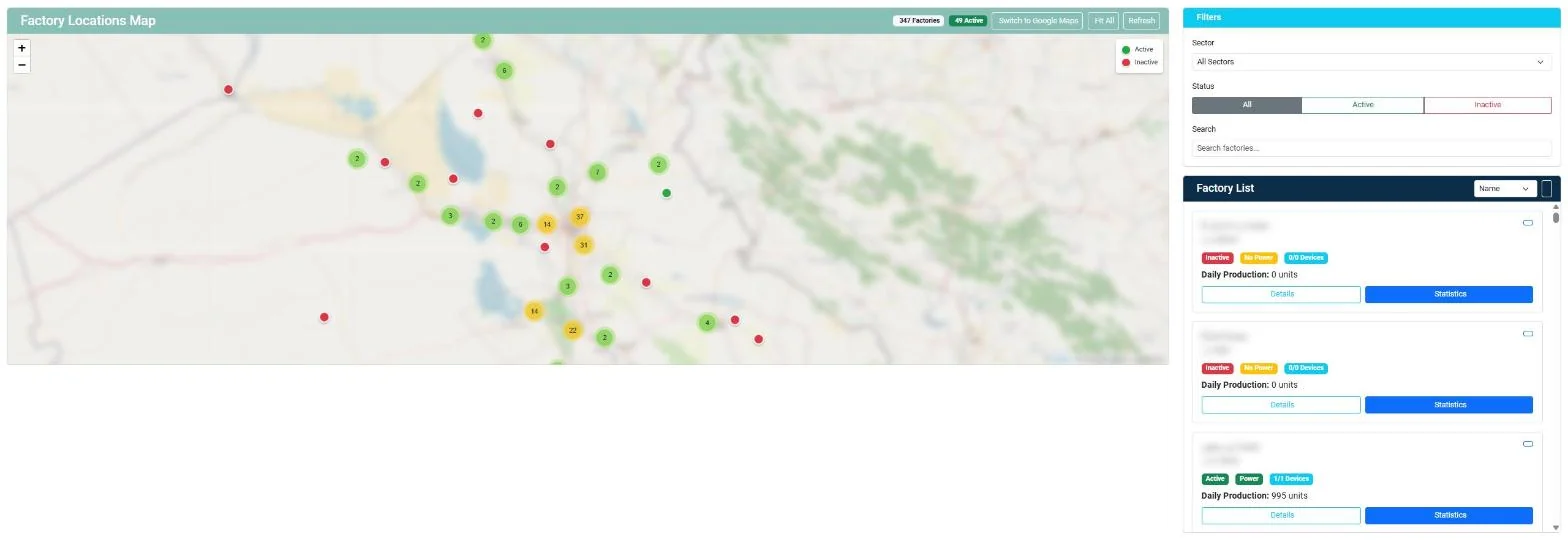
All factories on one map
Every factory with its location, sector and status. Active and inactive factories stand out at once, and for each factory you open the details or the statistics.
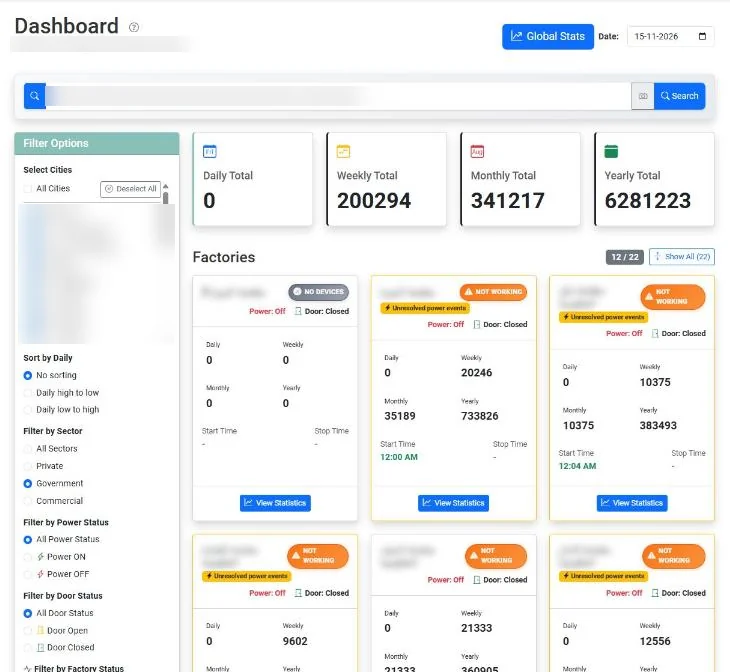
Today, this week, this year
The dashboard adds up production per day, week, month and year, for all factories together and per factory. You can filter by city, sector, power status, door status and factory status: working, idle, not working, offline or critical.
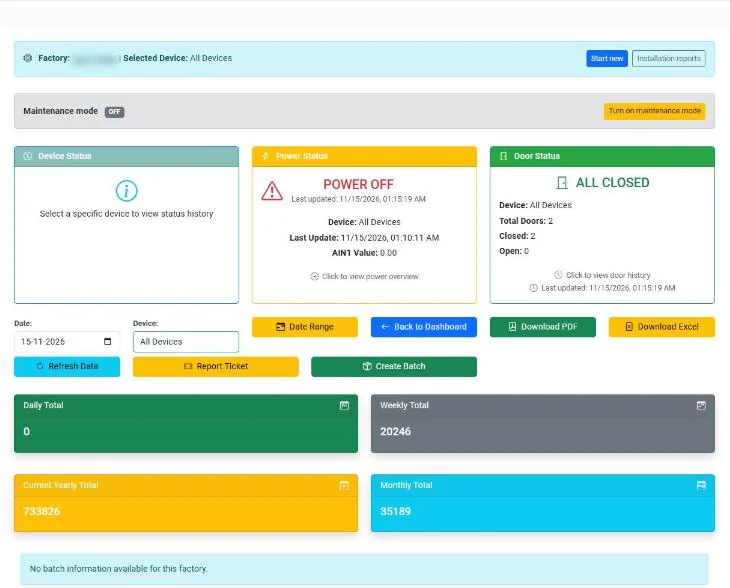
One factory in detail
For each factory you see the power status, the doors and the production totals. There is a maintenance mode, and reports go out as PDF or Excel. From the same screen you create a ticket or a production batch.
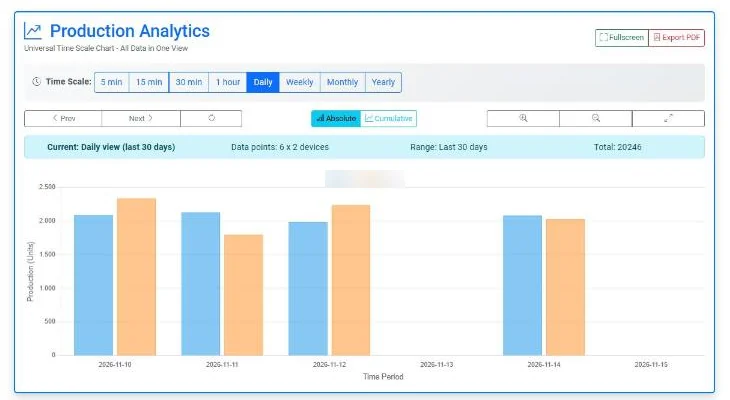
Production per device
Charts per device, from every 5 minutes to per year, absolute or cumulative. You see when a line stops or slows down.
Power and production side by side
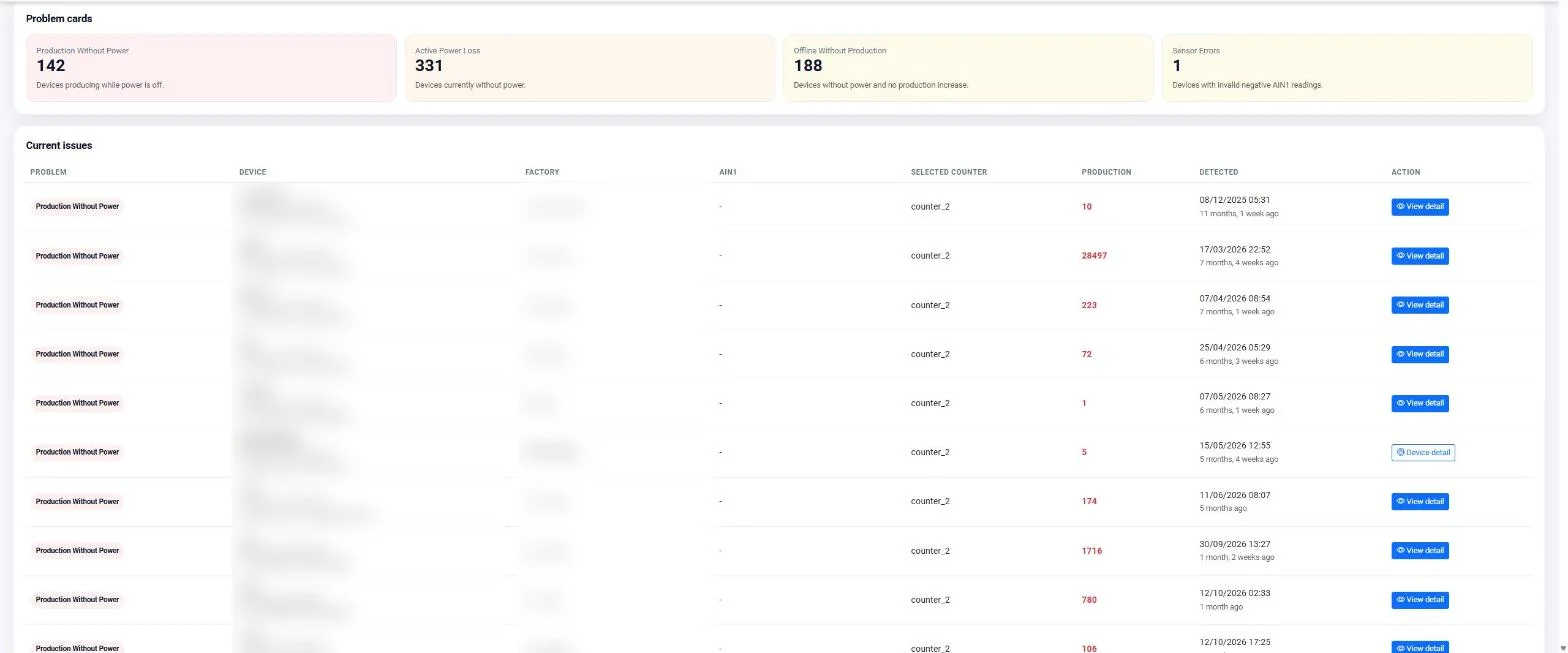
The platform puts power and production side by side. A device producing while the power is off, a power outage, or a sensor with impossible values: it lands on the list automatically, with the moment it was detected.
Also in the platform
Production batches
Create batches, have them approved and follow their progress.
Field installation
A wizard for technicians installing new devices, with an installation report.
Door history
When which door was opened, per factory.
Alerts
Configurable alerts for power events and anomalies.
Tickets
Report and follow up problems per factory.
Export
Export data for your own analysis.
How it works technically
In the factory, IoT controllers read the production counters, the power supply and the door contacts. They send their data over MQTT to a central server, where the platform processes it. The platform itself is a web application, with mobile apps alongside it.
For your business too
The principle works for any production environment: measure what happens, collect it automatically and flag what deviates. Whether it is machines, meters or doors, I am happy to look at what you can already measure.
Want to follow your production live?
I am happy to come by and look at the machines and meters you already have, and what it takes to read them. The first conversation is free.